RESEARCHERS AT ABERYSTWYTH ABER-SSP

Huw Morgan

Head of the Solar Physics group at Aberystwyth university.


Email:

Projects

3D Maps of the solar atmosphere

Huw Morgan
The Sun’s atmosphere flows into interplanetary space as the solar wind. Solar eruptions and streams of different speeds lead to rapid variations in this flow that impact Earth's magnetic field and can cause disruption to technology, economy and society - this is called space weather. Improved space weather forescasting depend critically on improving our understanding of the evolution of the solar wind near the Sun. Recent innovations in tomography techniques are opening a new window on this complex environment.
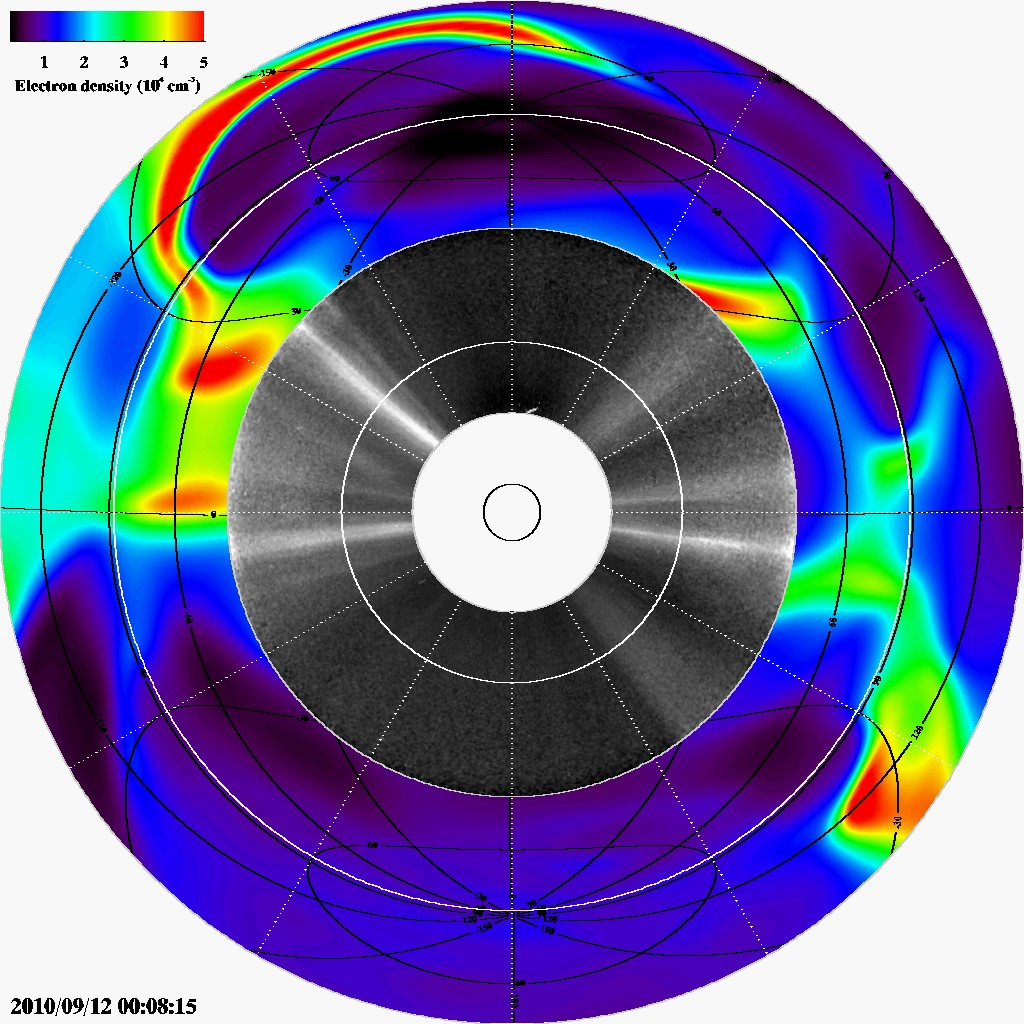
Coronagraphs on spacecraft take images of the extended solar atmosphere continuously. As the Sun slowly rotates (~every 4 weeks), the view of the corona changes. We use this information, using advanced methods, to derive the 3D structure of the corona's plasma. Thus the distribution of high and low density streams (corresponding to slow and fast flow speeds) is revealed. For the first time, this offers a direct mapping of the corona, and the ability to improve solar wind models that are central to predicting space weather.

Image: The Sun’s position is shown as the black inner circle. From 2 to 12 solar radii above the Sun, images are collected by coronagraph telescopes, as shown here in the black and white annular region above the Sun. The outer colour region shows the electron density of the solar atmosphere, gained from applying tomography to a time series of coronagraph observations.

Video: The changing structure of the solar corona over several years. This movie shows the electron density of the solar atmosphere at a height of 6 solar radii from the Sun, mapped in longitude and latitude. The movie begins during a period of minimum activity in 2009, to a period of maximum activity in 2012. During this time, we see high-density sheets (slow wind) gradually migrating to higher latitudes.

MGN Image Processing

Download: mgn.pro (Requires IDL 8.2< and an SSWIDL environment )
Docs: READ_ME

Overview

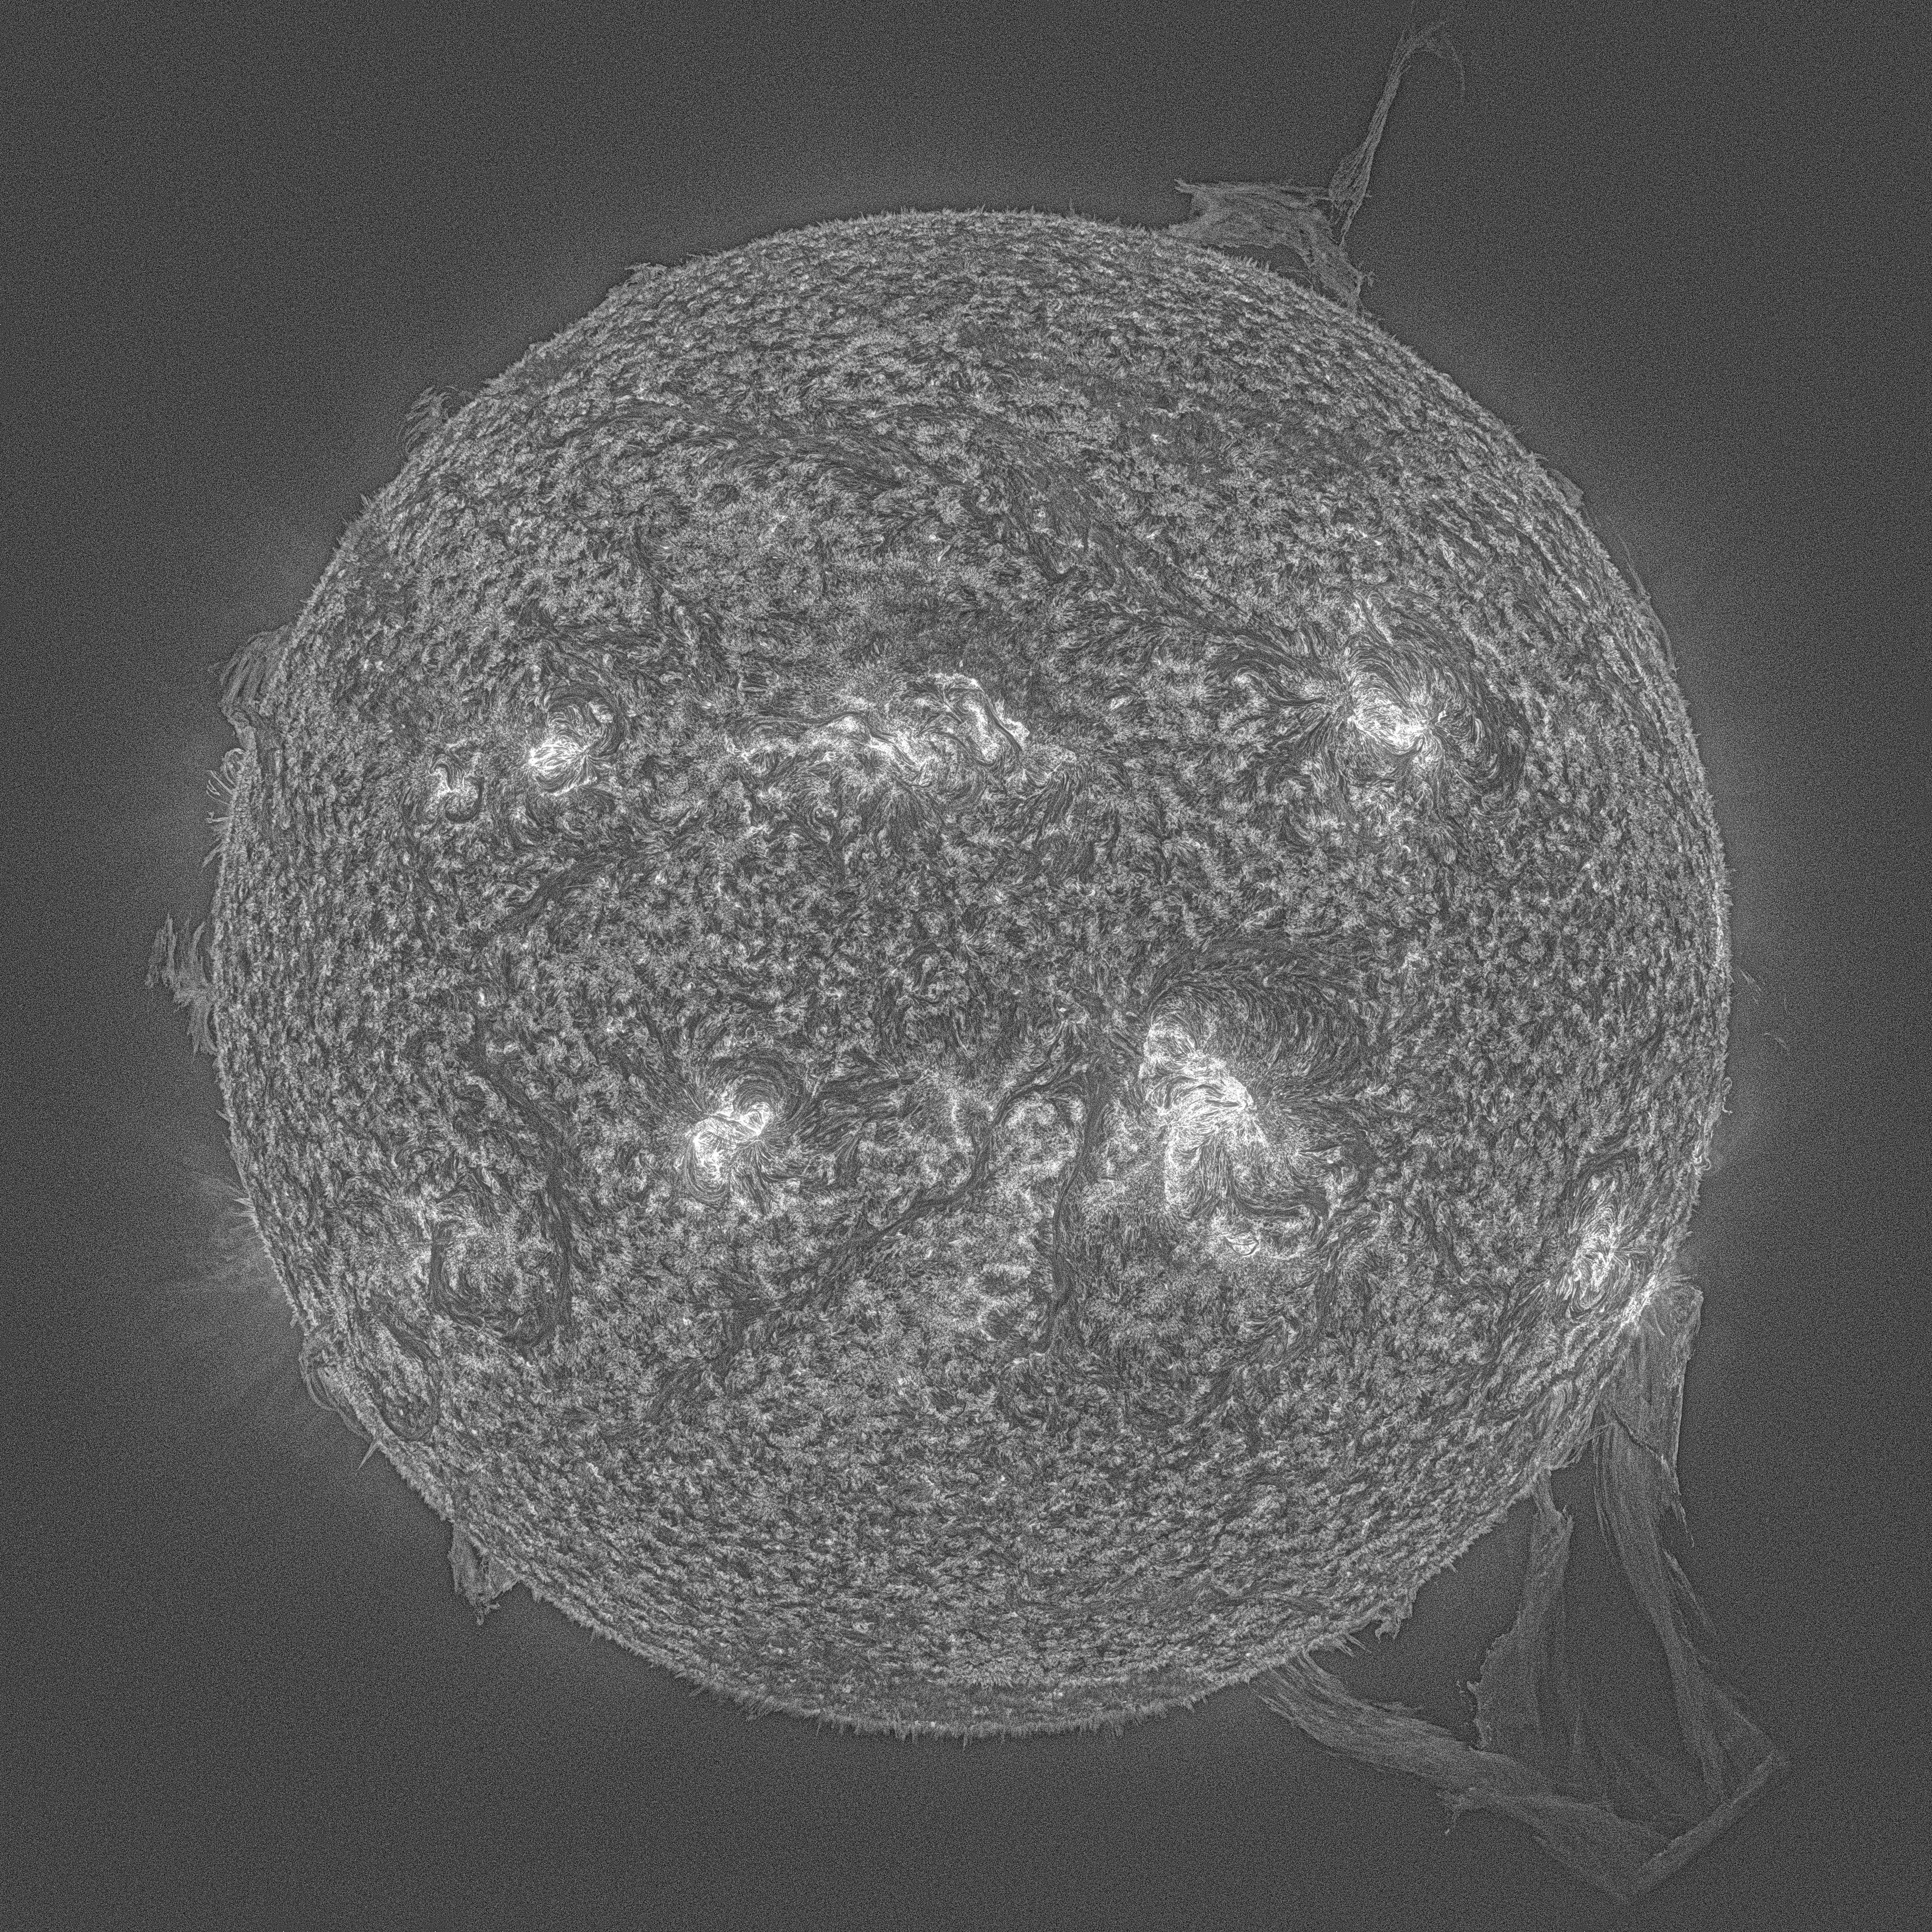
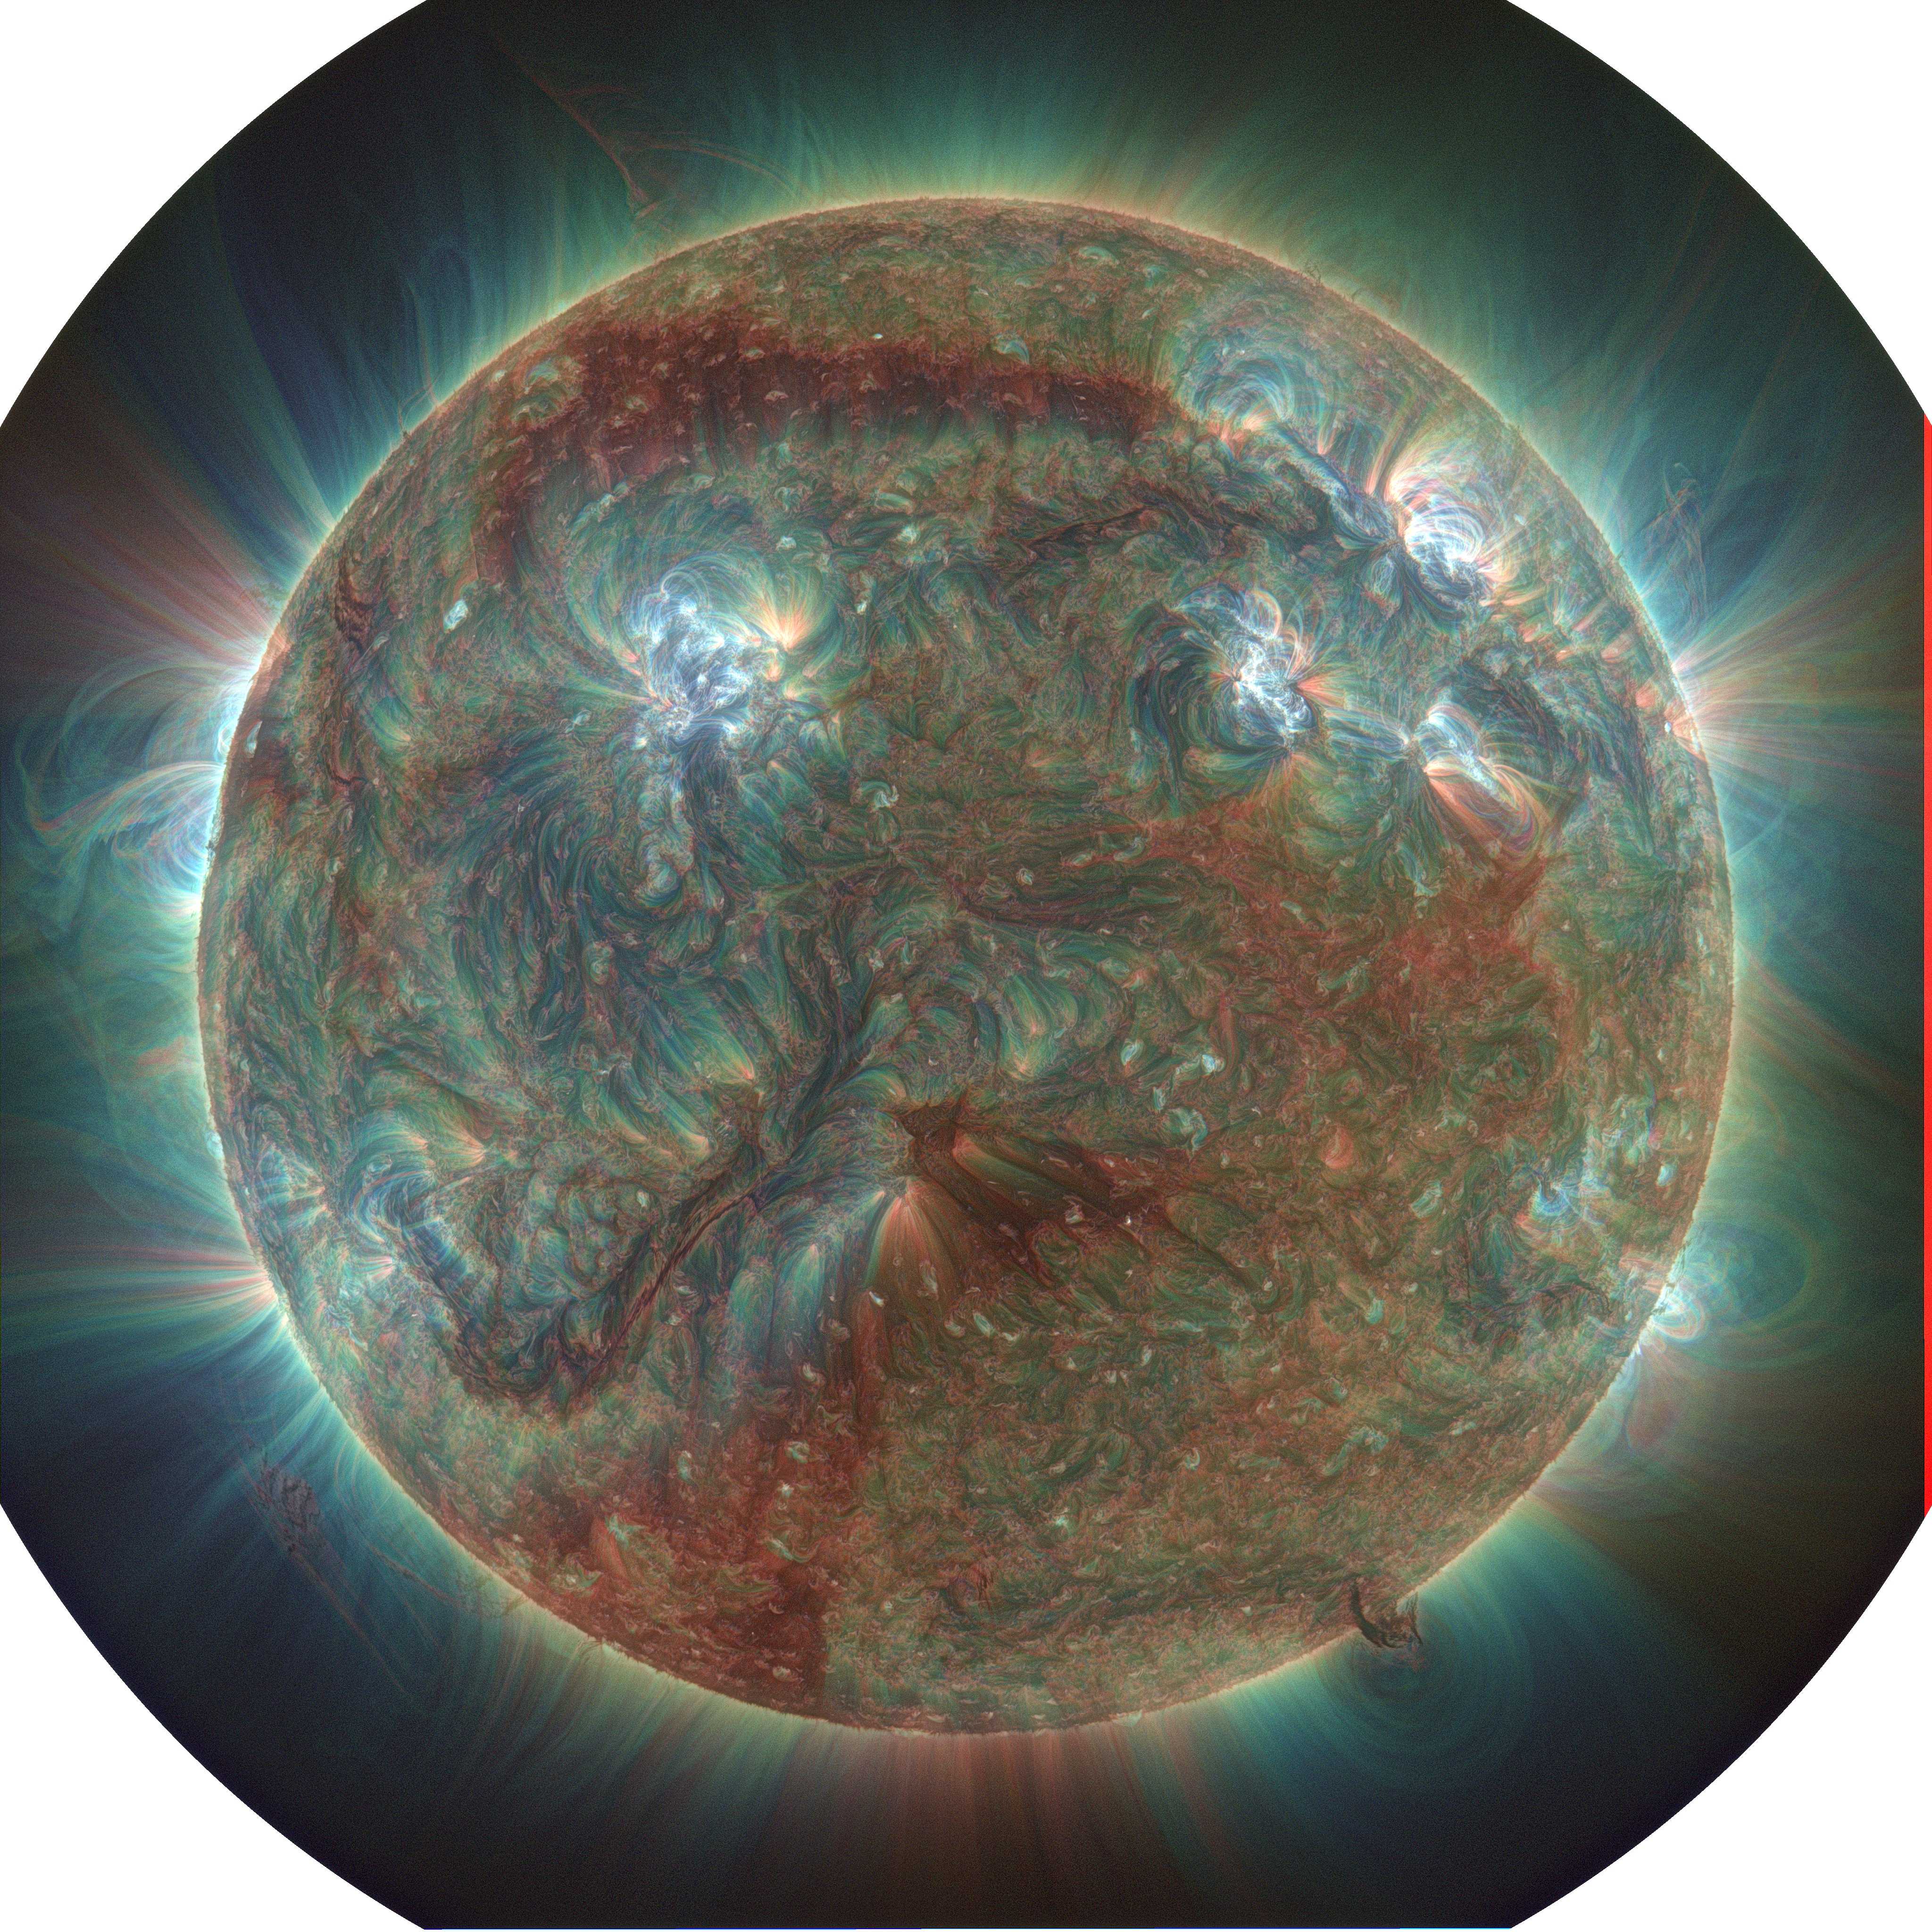
The Multiscale Gaussian Normalization(MGN) technique (Morgan & Druckmuller (2014)) is used to process solar EUV images. This technique aims at revealing information that is hidden in unprocessed EUV images by enhancing small-scale structure and overcoming the problem of revealing information in dark and bright regions simultaneously. It normalizes an image by using a local mean and standard deviation calculated using a Gaussian-weighted sample of local pixels at multiple scales. The final image is a weighted combination of the normalized components and the original gamma-transform image, and is very effective at revealing faint fine-scale details on the disk and off-limb regions.
The MGN software is available for download at the link above, and is compatible with all current distributions of IDL in a SolarSoftware (sswidl) environment. A read-me is also available.

Data Products


AIA/SDO Full Resolution
  • MGN-processed full-resolution AIA images
  • Processed images available for 7 AIA channels
  • 3-color (RGB) images combining data from 3 channels (171, 193, 211)
  • Note that this image archive is not complete
  • Images available in 3 sizes:

AIA/SDO Synoptic
  • AIA synoptic data is a valuable reduced-size archive provided by the Stanford JSOC service. These images lack the spatial clarity of the full-resolution observations, but enable us to provide MGN-processed images for every 10 or 30 minutes
  • Processed images available for 7 AIA channels
  • 3-color (RGB) images combining data from 3 channels (171, 193, 211)
  • Images available here

STEREO/EUVI
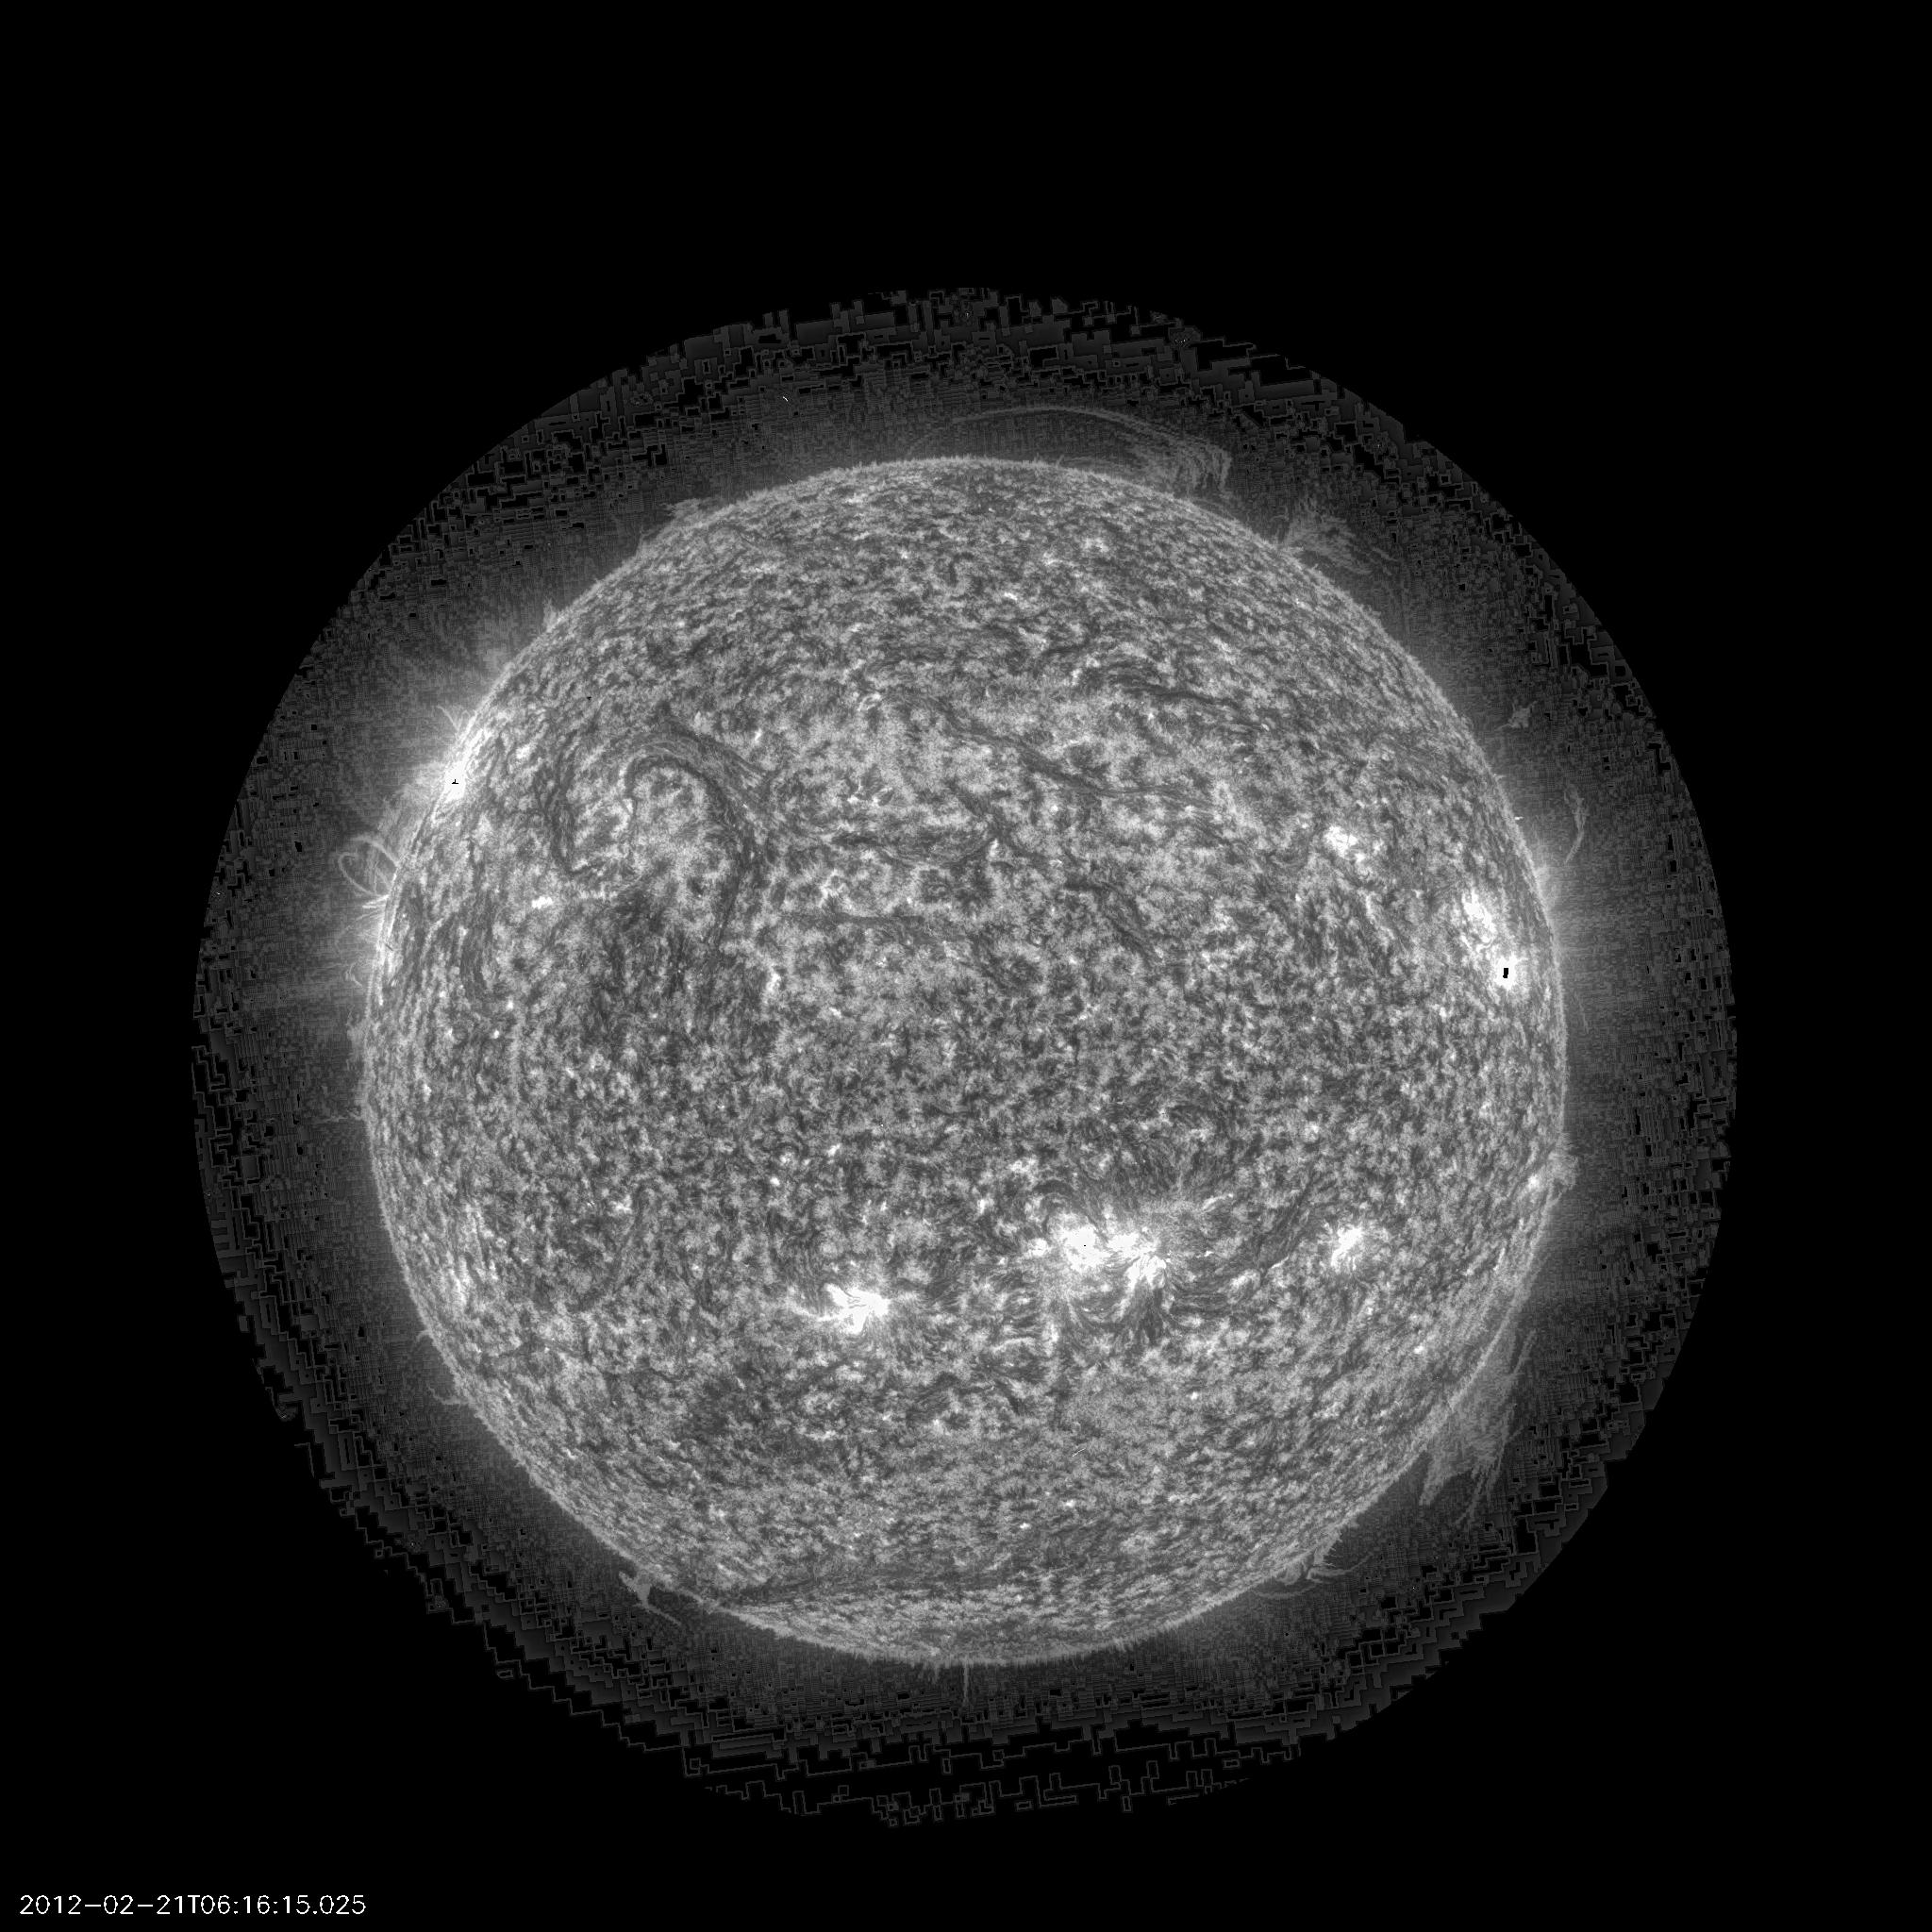
  • The STEREO/SECCHI Extreme UltraViolet Imagers (EUVI) provide 2048x2048 images of the low corona in 4 wavelength channels
  • Here we provide MGN-processed images for every 2 hours
  • Processed images available for 3 channels
  • 3-color (RGB) images combining data from 3 channels (171, 195, 284)
    • Images available for both STEREO A and B spacecraft:
    • EUVI A
    • EUVI B

Temperature Maps

Data (FITS): Archive
Data (jpg): Archive

Overview

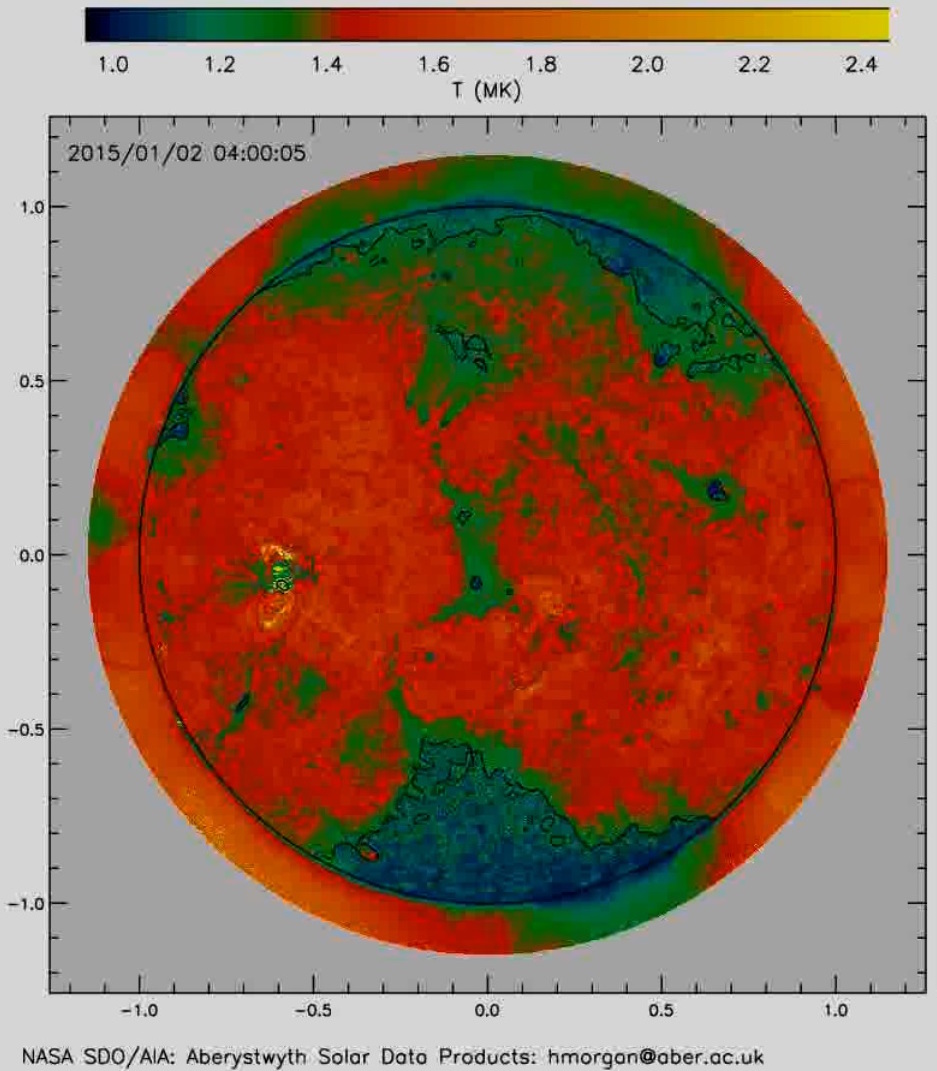
Multi-wavelength solar observations made by AIA/SDO allow us to produce temperature and emission measure maps of the low corona (Leonard & Morgan, 2015). An essential consideration in developing this archive is computational efficiency. The maps are therefore created using an isothermal approximation and this should be a consideration for anyone planning their use for science purposes. The maps are produced from the AIA 'synoptic' data, and have been produced for every 10 or 30 minutes. If you are using these maps for science, please contact the team.

DST and NRGF Image Processing

Overview

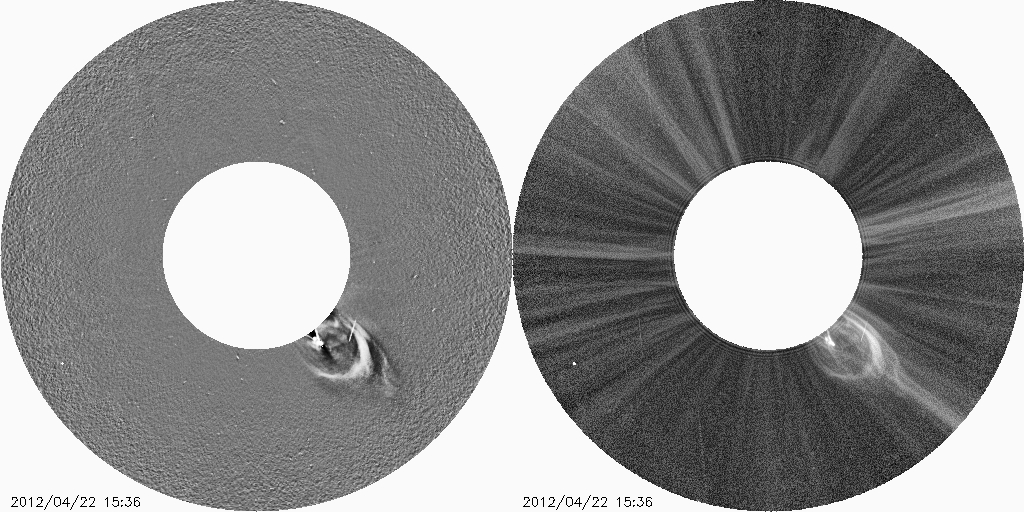
The Dynamic Separation Technique (DST, Morgan, Byrne & Habbal (2012) ) is a new technique based on spatial and time deconvolution of coronagraph data. It is an effective separation of the dynamic and quiescent components of the images. The structure of CMEs are revealed in detail despite the presence of background streamers that are several times brighter than the CME.
The normalized radial graded filter (NRGF, Morgan, Habbal & Woo (2006) ) is a simple filter for removing the radial gradient to reveal coronal structure. Applied to coronagraph data, the NRGF produces images which are striking in their detail.

Data Products

Electron density from LASCO C2

Download: IDL Save Files

Overview

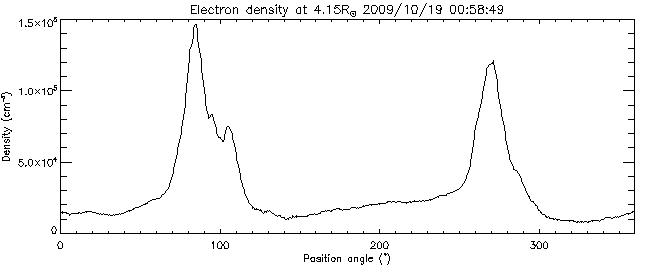
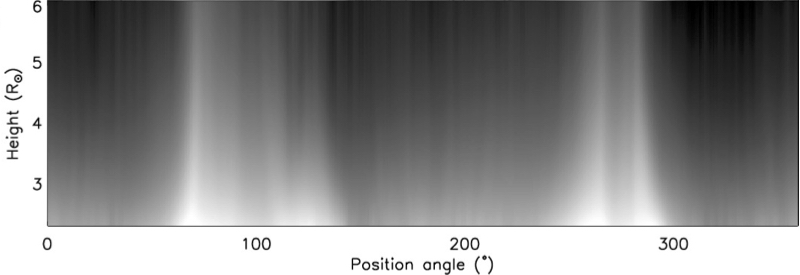
LASCO C2 polarized brightness images are calibrated (using stars) according to the methods of Morgan (2015). These are then inverted, assuming a local spherical symmetry, into an estimate of the coronal electron density. These are IDL save files, containing structures with polar-coordinate arrays of electron density and are available at the link above.

Calibrated LASCO C2

Download: IDL Save Files

Overview

Data processing and calibration is applied to LASCO C2 observations according to the method described in Morgan (2015). The methodology includes noise suppression, background subtraction and conversion of total to K-coronal brightness. These are IDL save files, containing structures with polar-coordinate images and are available at the link above

CORIMP CME Catalog

Overview

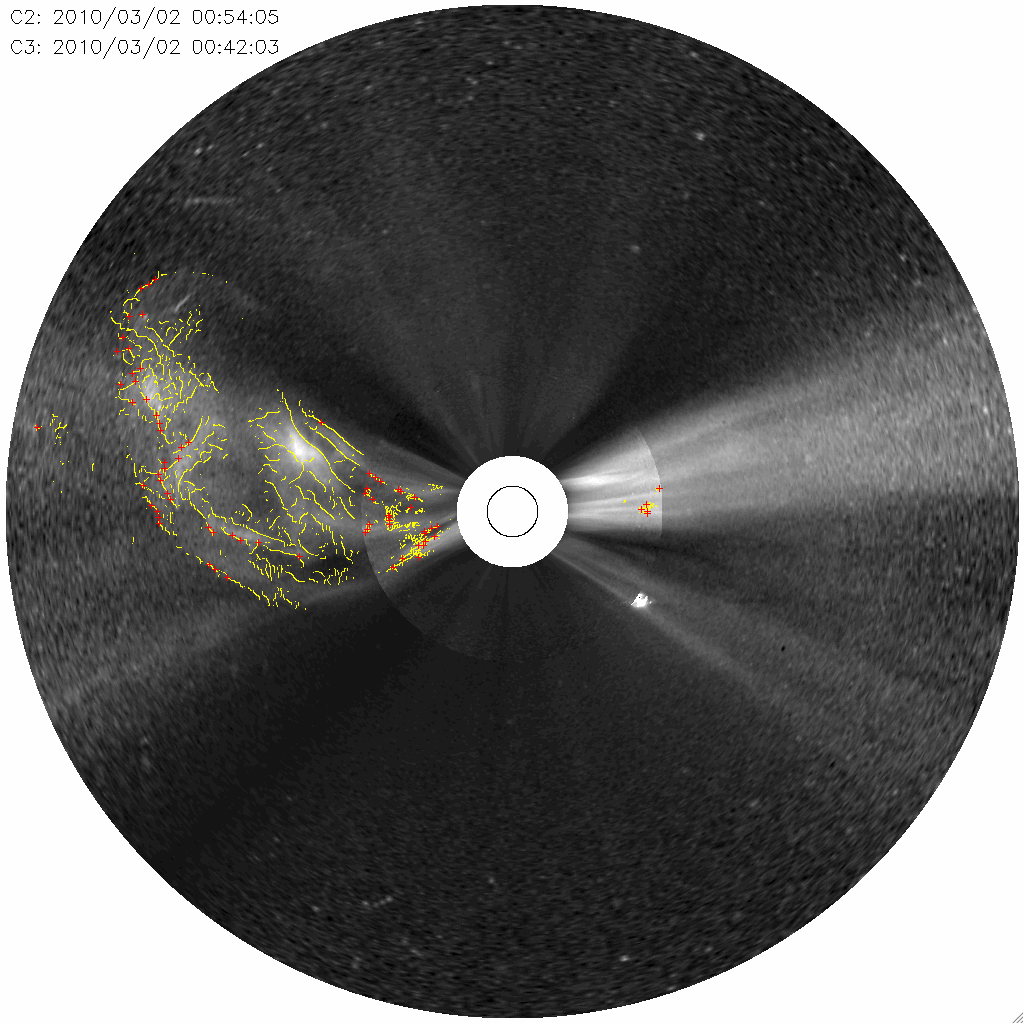
The coronal image processing (CORIMP) CME catalog is generated from the automatic detection and tracking of CMEs in images from the Solar & Heliospheric Observatory Large Angle & Spectrometric Coronograph experiment (SOHO/LASCO). The catalog utilizes a normalizing radial-graded filter (NRGF, see above) that removes the steep gradient in coronal brightness. A deconvolution technique is used to remove the static background, separating dynamic and quiescent structures. A multiscale decomposition then results in a number of scales upon which the images can be automatically inspected for curvilinear features. Detection masks are generated to isolate CME structure, and a sequence of observations then reveal the changing CME kinematics and morphology.

References

Details available in the following publications (please cite these two papers if using the catalog):